
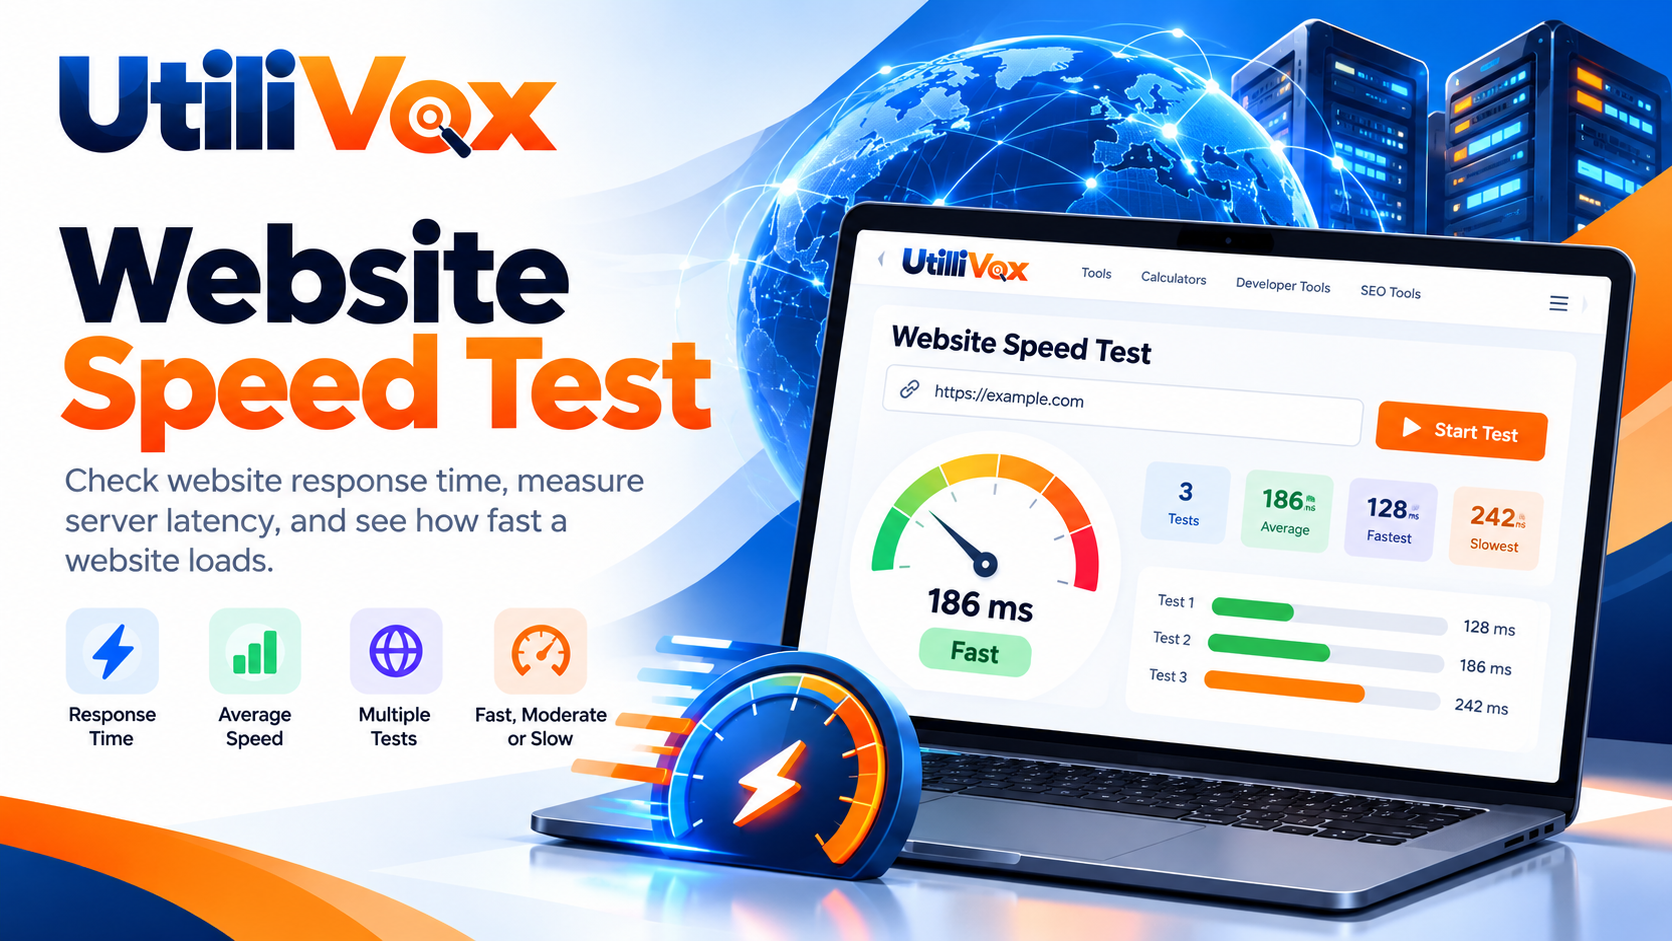
Website Speed Test: The Complete Guide
Understand website response time, learn how to run a basic test, interpret the results, and discover what to investigate when a website feels slow.
Read the guideA website speed test is a useful starting point for understanding how quickly a website responds to requests. This guide explains the current browser-based UtiliVox Website Speed Test, what its measurements mean, and when a deeper performance audit is needed.
1. What is a Website Speed Test Tool?
A Website Speed Test Tool is an online utility that helps users evaluate how quickly a website responds to a request. It can help developers, website owners, SEO professionals, and digital marketers investigate potential performance issues.
When a user enters a website address and starts a test, the browser sends requests to the target website and measures elapsed time for successful requests, provided the target website permits those cross-origin requests.
Website speed can influence user experience, visitor engagement, conversions, and search performance. Response time is only one part of performance: a full audit may also examine page rendering, image loading, JavaScript execution, and Core Web Vitals.
2. Why is Website Speed Important?
Slow or unreliable pages can make it harder for visitors to find information, complete purchases, submit forms, or move between pages. Performance testing helps teams identify possible issues and compare changes over time.
- User experience: responsive pages generally feel easier to use.
- E-commerce conversions: delays in product browsing and checkout can create friction.
- SEO: page experience and performance-related signals can contribute to search evaluation, but speed alone does not determine rankings.
- Technical troubleshooting: response-time measurements can reveal inconsistent server responses.
- Monitoring: repeated tests can help compare results before and after a website change.
- Development: developers can use simple response checks as an initial diagnostic before a deeper audit.
A good response-time result does not automatically mean a website is fully optimized. Large images, render-blocking scripts, third-party services, or inefficient front-end code can still slow the complete page.
3. A Brief History of Website Speed Testing
Website speed testing evolved as websites became more complex. The following are broad stages in that evolution, not exact invention dates for individual tools.
1990s — Early web
Websites often consisted of simple HTML documents and a few images. Developers commonly judged loading behavior through direct observation and basic timing.
2000s — More complex sites
JavaScript, CSS, databases, advertising, and larger images made performance harder to diagnose. Browser tools and network monitoring became more useful.
2010s — Automated audits
Tools such as Google PageSpeed Insights and WebPageTest helped broaden access to performance analysis, resource diagnostics, and recommendations.
2020s — User experience
Testing increasingly includes real-user data and Core Web Vitals: Largest Contentful Paint (LCP), Interaction to Next Paint (INP), and Cumulative Layout Shift (CLS).
4. How Does the UtiliVox Tool Work?
The current UtiliVox version uses a browser-based request-timing approach.
- Enter the URL: the tool validates the address and prepares a request.
- Measure response time: the browser records elapsed time for each successful request.
- Calculate the average: successful measurements are averaged and displayed in milliseconds.
- Review the result: check the average response time, the tool's response indicator, and any request errors.
5. How to Use the Website Speed Test
- Open the UtiliVox Website Speed Test page.
- Enter the full website URL, for example
https://example.com. - Choose the number of attempts:
- 3 attempts: a quick check.
- 5 attempts: a useful basic comparison.
- 8 attempts: more observations, although results may still vary.
- Click Start Test and wait for requests to finish.
- Review the average response time and test status.
- Repeat the test later or under similar network conditions to compare results.
For more consistent comparisons, use the same device, browser, internet connection, and target URL. A test over mobile data may not be directly comparable with one over high-speed broadband.
6. Understanding the Results
| Result | Meaning |
|---|---|
| Average response time | Average elapsed time for successful browser requests. |
| Fast response | The current tool's average is below 200 ms. |
| Moderate response | The current tool's average is 200–599 ms. |
| Slow response | The current tool's average is 600 ms or higher. |
| Download speed | Not measured by the current version. |
| Upload speed | Not measured by the current version. |
The fast, moderate, and slow labels are simple indicators used by the current tool, not universal website-performance standards. A low response time can be encouraging, but it does not prove that the entire page renders quickly.
Network distance, caching, server load, redirects, browser restrictions, and other factors can affect the measurements.
7. Average Response-Time Formula
The average response time is calculated by adding the successful measurements and dividing the total by the number of successful measurements.
Where:
- Tavg is the average response time in milliseconds.
- Ti is the elapsed time of each successful request.
- n is the total number of successful measurements.
Worked example
Suppose three successful requests take 120 ms, 150 ms, and 180 ms.
The average response time is 150 milliseconds.
8. What the Tool Does Not Measure
It is important to distinguish response time from complete website performance.
- Full page-load time: how long the page and its relevant resources take to load.
- Download bandwidth: how quickly data can be transferred from a suitable test server.
- Upload bandwidth: how quickly data can be sent to a suitable test server.
- Core Web Vitals: LCP, INP, and CLS, which relate to loading, responsiveness, and visual stability.
- Lighthouse performance score: a broader audit score based on multiple performance metrics.
For a more complete diagnosis, use Google PageSpeed Insights, browser developer tools, or WebPageTest. These provide capabilities beyond a basic response-time test.
9. Who Should Use This Tool?
Web developers
Investigate response-time changes after deployments, hosting changes, or configuration updates.
SEO professionals
Use a basic response check before a more complete technical SEO and page-performance audit.
E-commerce owners
Investigate possible responsiveness issues affecting product pages, storefronts, and customer journeys.
Hosting administrators
Compare basic response behavior before and after server, DNS, caching, or hosting changes.
10. Tips for Improving Website Speed
If a website appears slow, investigate these areas and prioritize changes based on diagnostic evidence.
- Optimize large images and use suitable modern image formats.
- Enable appropriate browser caching and compression.
- Remove unnecessary JavaScript and CSS.
- Review render-blocking resources.
- Investigate server response times, database queries, and hosting configuration.
- Consider a content delivery network (CDN) when appropriate for your audience.
- Measure Core Web Vitals on both mobile and desktop.
- Repeat tests under comparable conditions before deciding whether an optimization worked.
Do not rely on response time alone to decide which change to make. A detailed audit can help identify the bottleneck that matters most.
11. Frequently Asked Questions
Is the UtiliVox Website Speed Test free?
The current tool is designed as a browser-based utility and does not require a backend service for its basic request-timing workflow.
Why does my test fail on some websites?
The target website may block cross-origin requests, be temporarily unavailable, or take longer than the request timeout. A failed test does not necessarily mean the target website is down.
Does this tool measure Google PageSpeed scores?
No. The current version measures average browser request response time, not Lighthouse scores or Core Web Vitals.
Can it measure my internet speed?
Not reliably. Download and upload bandwidth tests require dedicated test data and a compatible endpoint. This tool checks a target website's response behavior instead.
Does a fast response guarantee good SEO?
No. Response time is only one performance-related consideration. Search visibility also depends on relevance, content quality, crawlability, competition, and other factors.
Why do results change between tests?
Server load, network congestion, caching, DNS behavior, routing, and other factors can vary between requests.
12. Conclusion
The UtiliVox Website Speed Test provides a convenient starting point for investigating website responsiveness. By measuring successful browser requests and calculating their average elapsed time, it helps users compare basic response behavior and recognize possible issues.
For a complete performance assessment, combine response-time checks with page-load analysis, real-user performance data, Core Web Vitals, and a detailed technical audit.
Editorial note: Threshold labels in this guide describe the current UtiliVox tool's indicators. They should not be interpreted as universal benchmarks or a substitute for a full performance audit.
Mathematical Formula
Average Response Time
Where:
Tavg= Average measured response timeTi= Response time for each successful requestn= Number of successful measurements
Step-by-Step Worked Example
Enter a website URL, such as https://example.com.
Select 3, 5, or 8 response test attempts.
Click Start Test.
The tool measures the elapsed time for each successful browser request.
Suppose three successful measurements are 120 ms, 150 ms, and 180 ms.
Calculate the average: (120 + 150 + 180) ÷ 3 = 150 ms.
Review the average response time and the response-speed indicator.
Important Considerations & Limitations
Measures browser request response time, not complete page-load time.
Cross-origin resource sharing (CORS) restrictions may prevent requests to some websites.
Response time depends on the user's internet connection, browser, network conditions, and target server.
Download and upload bandwidth are not measured by the current implementation.
Does not provide Google Lighthouse scores, Core Web Vitals, or a full performance audit.
Results are estimates from the successful requests, not a guarantee of overall website performance.
A complete performance test would require a compatible testing endpoint or external performance API.
Continue your workflow with these verified calculators and utilities: